Sexual Diversity of Vertebrates
Data Visualization, Infographic, Scientific
Description
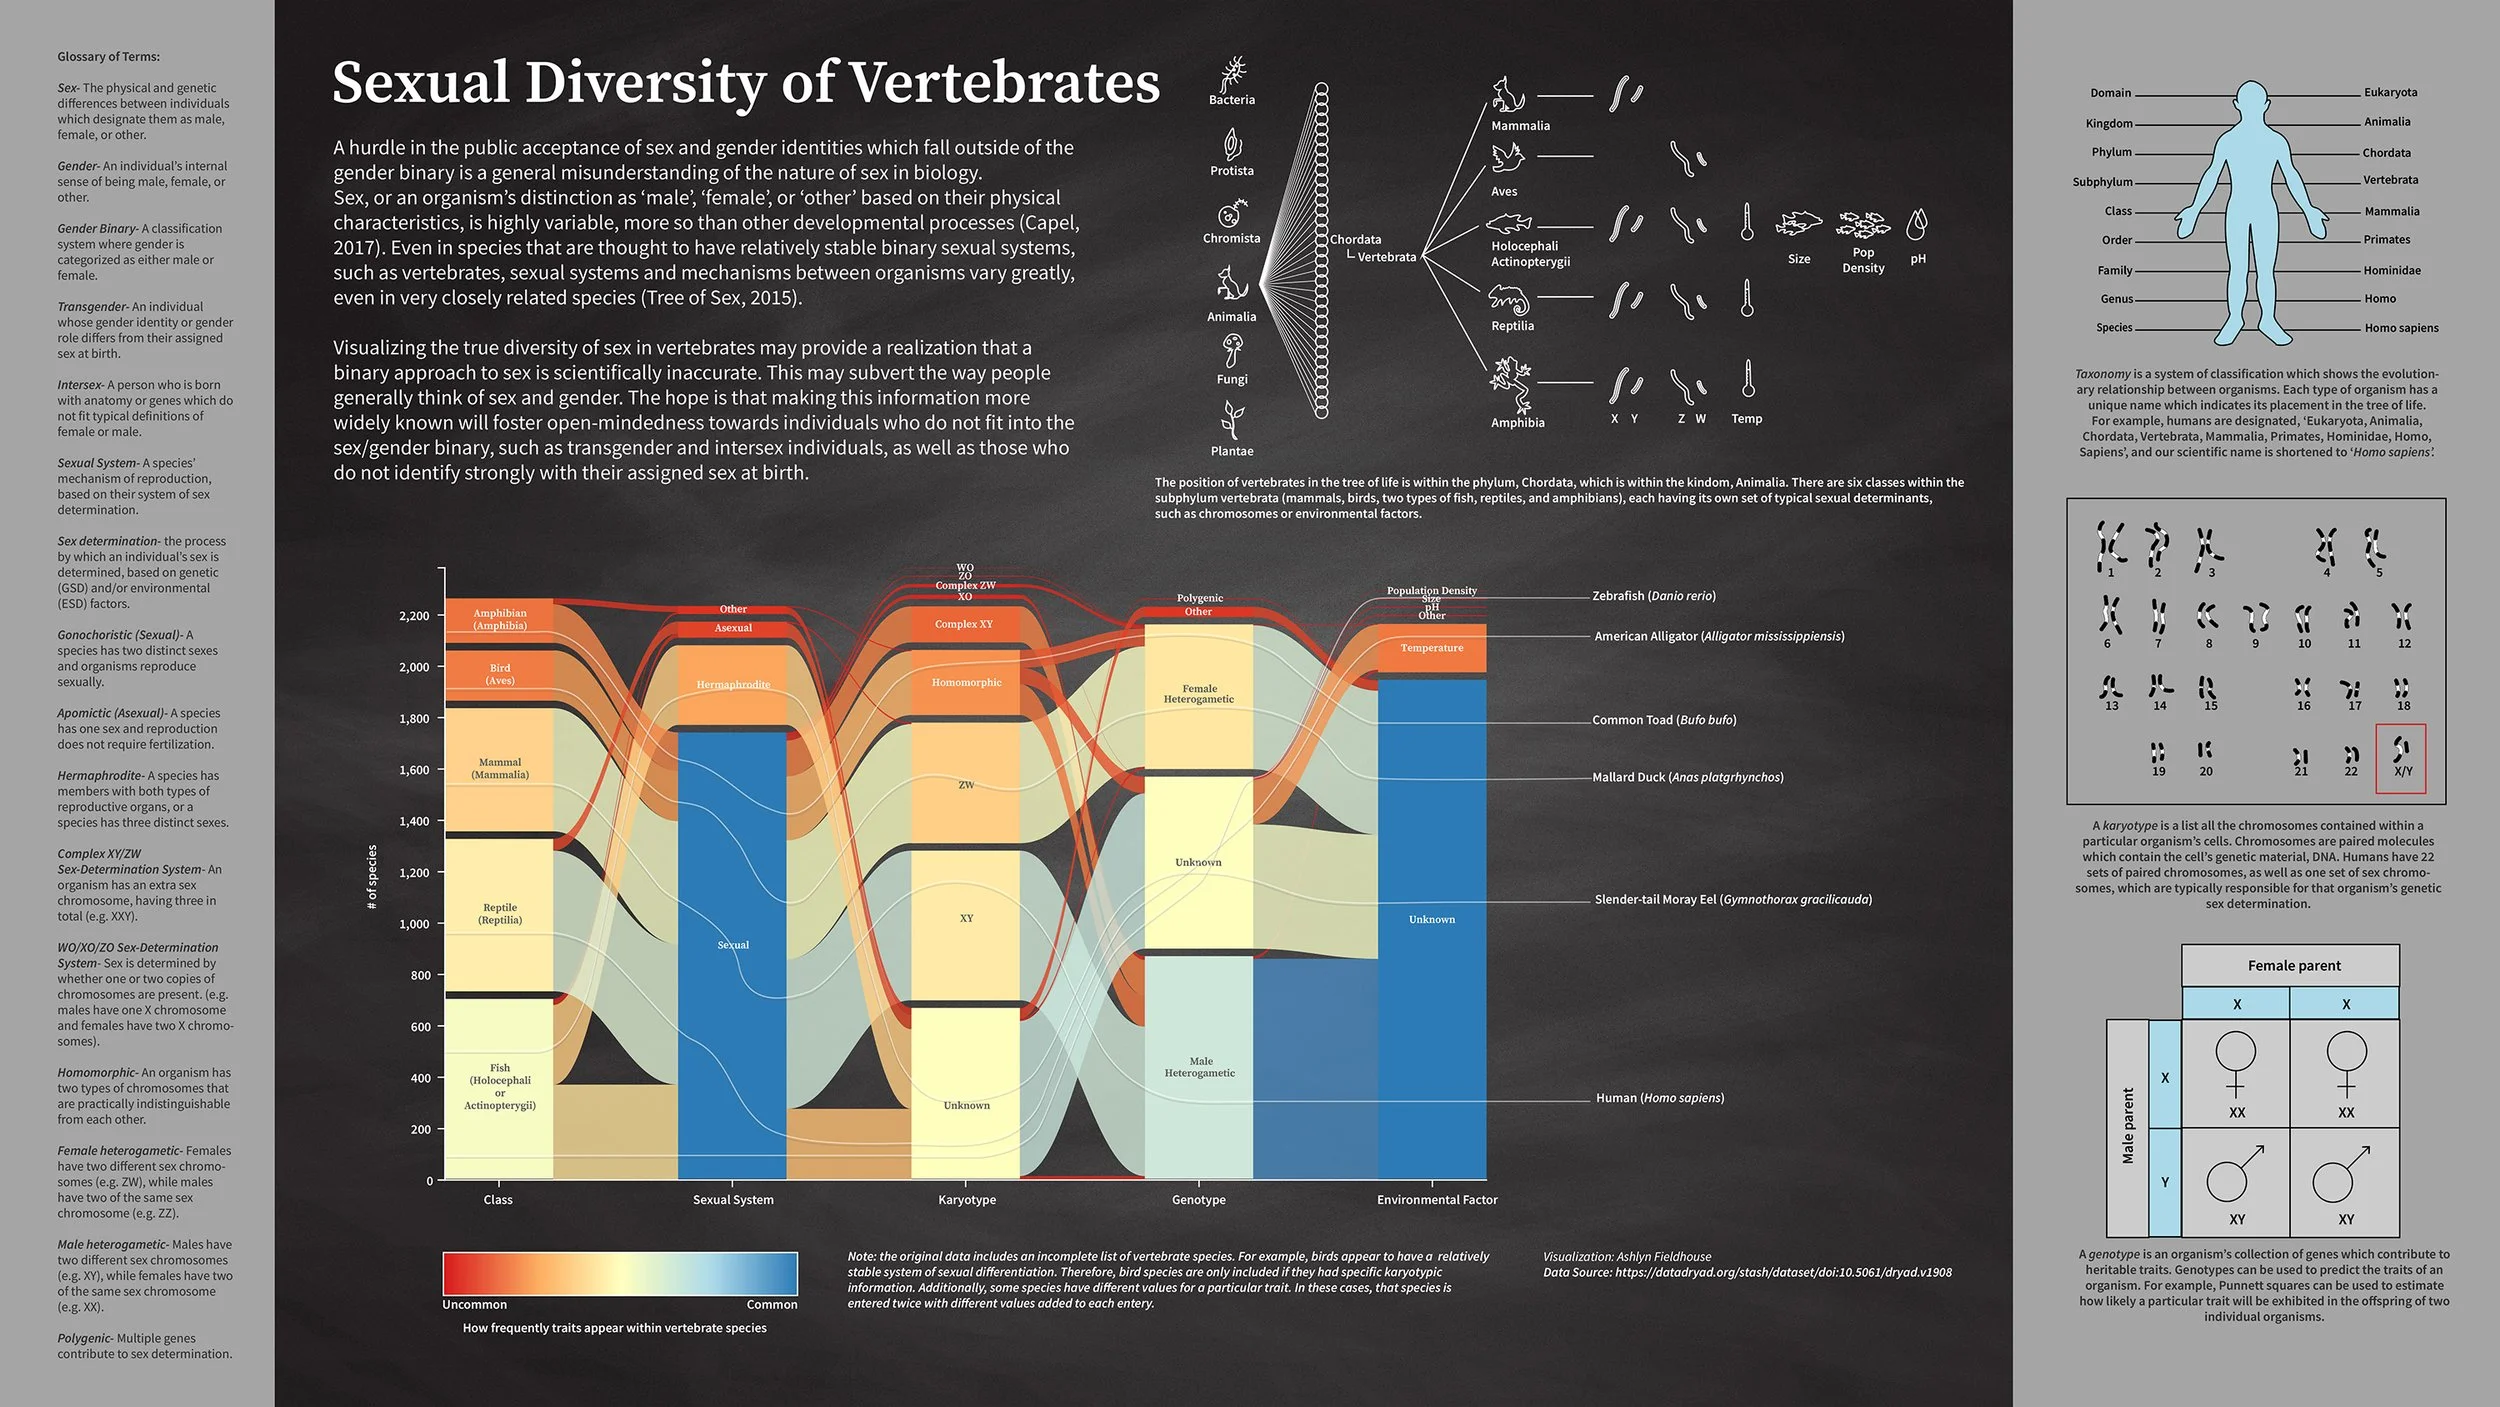
This project involved creating a data visualization from a multivariate dataset obtained from The Tree of Sex Consortium (2015).
The main diagram in this visualization is an alluvial diagram that describes the diversity of sex determination in vertebrate species. The piece also includes a glossary of relevant terms and several infographics to explain information necessary to understanding the alluvial diagram.
Tableau Prep and Microsoft Excel were used to organize data. Charticulator was used to generate the main alluvial diagram. Adobe Photoshop was used for sketches, and Adobe Illustrator was used for text, icons, and all other design elements.
Year
2022
Tools
Charticulator, Tableau Prep, Microsoft Excel, Adobe Photoshop, Adobe Illustrator
Media
Print- academic poster or textbook spread
Client
Jodie Jenkinson
Audience
Post-secondary biology stream students
Details


References
Dataset:
Consortium, The Tree of Sex et al. (2015). Data from: Tree of sex: A database of sexual systems [Data set]. Dryad. https://doi.org/10.5061/dryad.v1908
Consortium, The Tree of Sex. (2014). Tree of sex: A database of sexual systems. Scientific Data, 1(140015). doi: 10.1038/sdata.2014.15 (2014).
Content references (additional content and understanding terms):
A Glossary: Defining Transgender Terms. (2018). American Psychological Association 49(8), 32. Retrieved April 11, 2022, from https://www.apa.org/monitor/2018/09/ce-corner-glossary
Alluvial Diagrams. (n.d.). Origin Lab. Retrieved March 27, 2022, from https://www.originlab.com/doc/Origin-Help/Alluvial-Diagram
Austin, C. P. (n.d.). Genotype. National Human Genome Research Institute. Retrieved April 11, 2022, from https://www.genome.gov/genetics-glossary/genotype
Blackmon, H., Ross, L., & Bachtrog, D. (2017). Sex determination, sex chromosomes, and karyotype evolution in insects. Journal of Heredity, 108(1), 78-93. https://doi.org/10.1093/jhered/esw047
Breed, M. D., & Moore, J. (2016). Social behavior, cooperation, and kinship. Animal behavior (2nd ed., pp. 423-458). https://doi.org/10.1016/B978-0-12-801532-2.00013-1
Cain, A. (2020, June 22). Taxonomy. Encyclopedia Britannica. https://www.britannica.com/science/taxonomy
Capel, B. (2017). Vertebrate sex determination: evolutionary plasticity of a fundamental switch. Nature Reviews Genetics, 19, 675-689. https://doi.org/10.1038/nrg.2017.60
Catalogue of Life. (n.d.). Catalogue of Life. Retrieved March 27, 2022, from https://www.catalogueoflife.org/
Chromosome Fact Sheet. (2020). National Human Genome Research Institute. Retrieved April 11, 2022, from https://www.genome.gov/about-genomics/fact-sheets/Chromosomes-Fact-Sheet
Colour Brewer. (n.d.). Axis Maps. Retrieved March 27, 2022, from https://colorbrewer2.org/#type=sequential&scheme=BuGn&n=3
Dewey, T. (2008). Homo sapiens. Animal Diversity Web. https://animaldiversity.org/accounts/Homo_sapiens/
Graves, J. (2016). Sex, genes, the y chromosome and the future of men. Life Sciences. Retrieved March 27, 2022, from https://scitechconnect.elsevier.com/sex-genes-y-chromosome-future-of-men/
Koonin, E. V. (2010). The two empires and three domains of life in the postgenomic age. Nature Education, 3(9), 27. Retrieved March 27, 2022, from https://www.nature.com/scitable/topicpage/the-two-empires-and-three-domains-of-14432998/#:~:text=Even%20under%20this%20new%20network,and%20Eukarya%20%E2%80%94%20remain%20objectively%20distinct.
Meisel, R. P., Davey, T., Son, J. H., Gerry, A. C., Shono, T., & Scott, J. G. (2016). Is multifactorial sex determination in the house fly, musca domestica (L.), stable over time? Journal of Heredity, 107(7), 615-625. https://doi.org/10.1093/jhered/esw051
Myers, P., Espinosa, R., Parr, C. S., Jones, T., Hammond, G. S., & Dewey, T. A. (2022). Organismal classification: Evolutionary relationships and ranks. The Animal Diversity Web. https://animaldiversity.org/animal_names/phylogeny_ranks/
Ozias-Akins, P., & Conner, J. A. (2012). Regulation of apomixis. Plant biotechnology and agriculture: Prospects for the 21st century (pp. 243-254). https://doi.org/10.1016/B978-0-12-381466-1.00016-X
Sex and Gender: What is the Difference? (2021). Medical News Today. Retrieved April 11, 2022, from https://www.medicalnewstoday.com/articles/232363#sex
Subramoniam, T. (2017). Sexual systems. Sexual biology and reproduction in crustaceans (pp. 57-103). https://doi.org/10.1016/B978-0-12-809337-5.00003-4
What is Intersex? (n.d.) Intersex Society of North America. Retrieved April 11, 2022, from https://isna.org/faq/what_is_intersex/
Yano, C. F., Poltronieri, J., Bertollo, L. A. C., Artoni, R. F., Liehr, T, & Cioffi, M. B. (2014). Chromosomal mapping of repetitive DNAs in Triportheus trifurcatus (Characidae, Characiformes): Insights into the differentiation of the Z and W Chromosomes. PLoS ONE 9(3), e90946. DOI:10.1371/journal.pone.0090946